
Case Study
Scalable PDP Infographic Templates
Performance Outcomes
A data-driven visual strategy that transformed technical specs into high-converting sales assets, directly impacting average time-on-page and bounce rates.
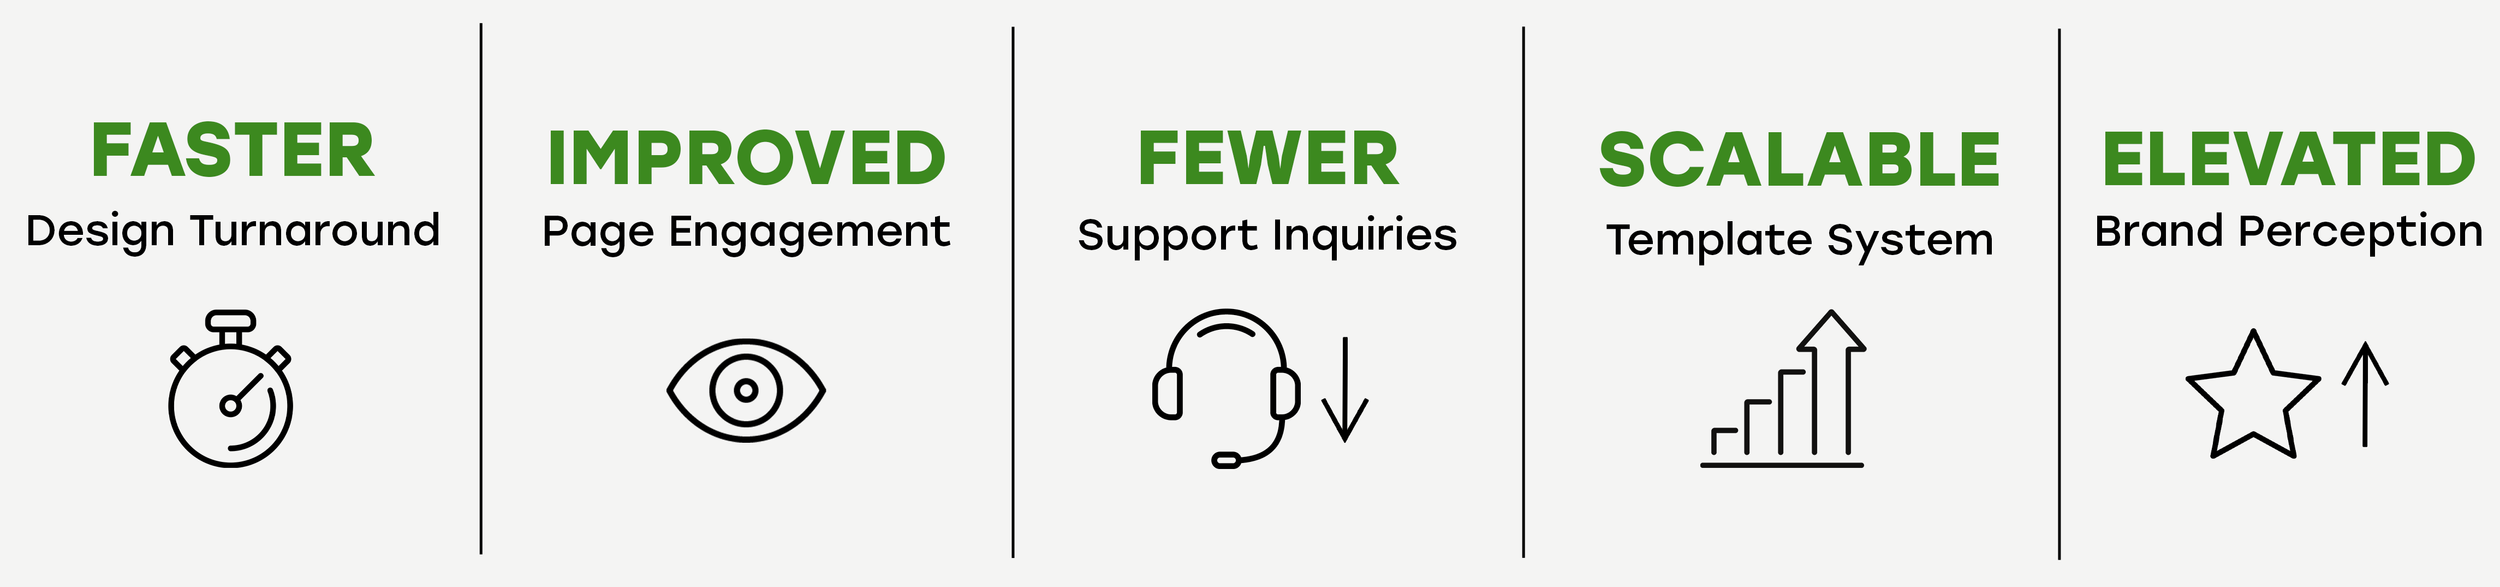
30% Lift in Click-Through Rate (CTR)
100% Scalability Across New Product Lines
Reduced Returns via Better Visual Education
Project Overview
To enhance clarity and visual appeal on product detail pages (PDPs), we launched an initiative to create a scalable library of infographic templates. These assets were designed to clearly communicate key product features, specifications, and benefits in a visually engaging, brand-aligned format. As our catalog continues to grow, this system ensures both consistency and creative flexibility.
The Challenge
Text-heavy Product Detail Pages (PDPs) were causing high bounce rates and customer confusion. The lack of visual education created a barrier to purchase for complex B2B products, leading to missed revenue opportunities.
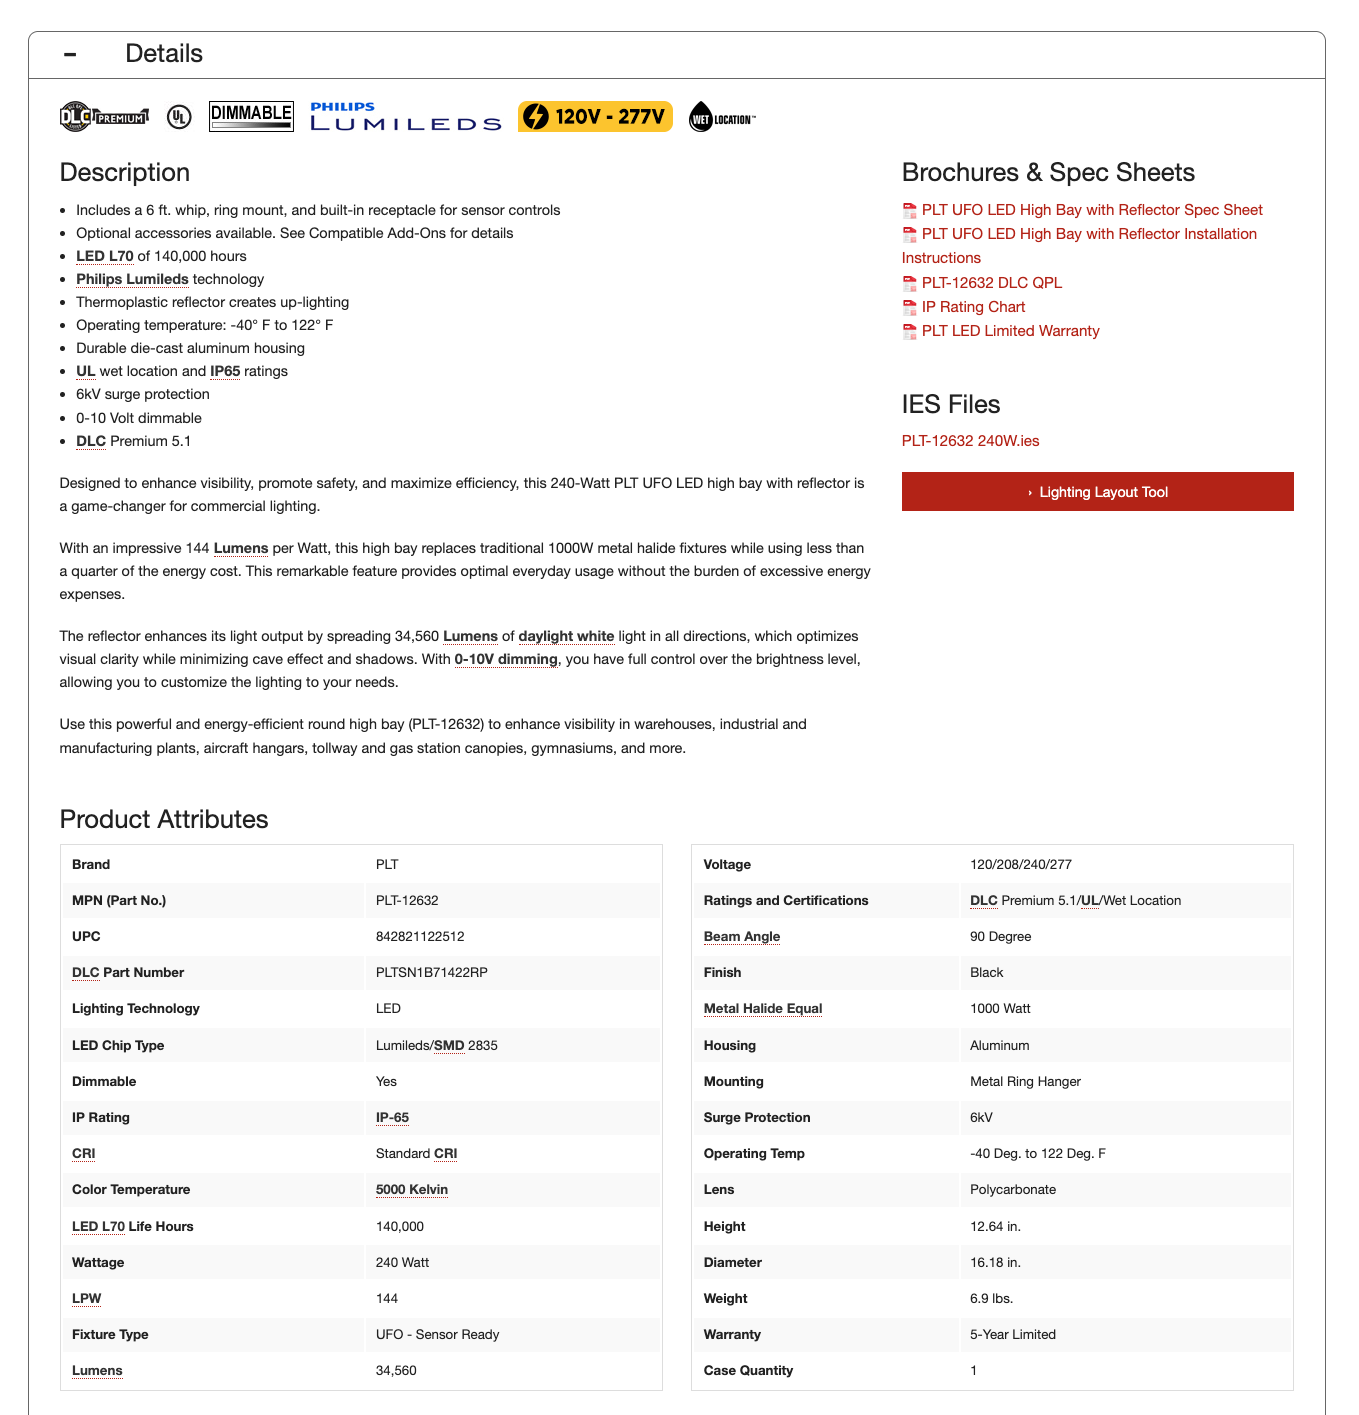
Other than product photos, PDPs were text-heavy and visually sparse. Before implementing our infographic system, PDPs relied solely on dense technical copy and feature lists. Without visual aids, critical selling points were often overlooked—creating friction for customers and missed opportunities to engage.
The Conversion Asset Architecture
I architected a modular visual system designed to answer customer objections before they reached customer service. By templatizing key value props (IP Ratings, Energy Savings), we allowed the marketing team to deploy high-fidelity assets across thousands of SKUs instantly.
My Role:
Directed the cross-functional initiative between Merchandising, Sales, and Creative to define the 'Key Selling Points' that drive conversion, then built the design system to execute them at scale.
This infographic template visualizes the full Kelvin scale, highlighting the product’s specific color temperature or range, in the case of selectable products. Rather than pre-rendering every possible variation, our designers can easily generate custom combinations on demand using the project file—ensuring visual accuracy for any new product without starting from scratch.
Final Takeaway
This infographic system proved that high-end visual storytelling doesn’t have to come at the expense of speed or scale. It established a new visual standard across our product pages while empowering our design team to move faster, work smarter, and support the customer journey more effectively.